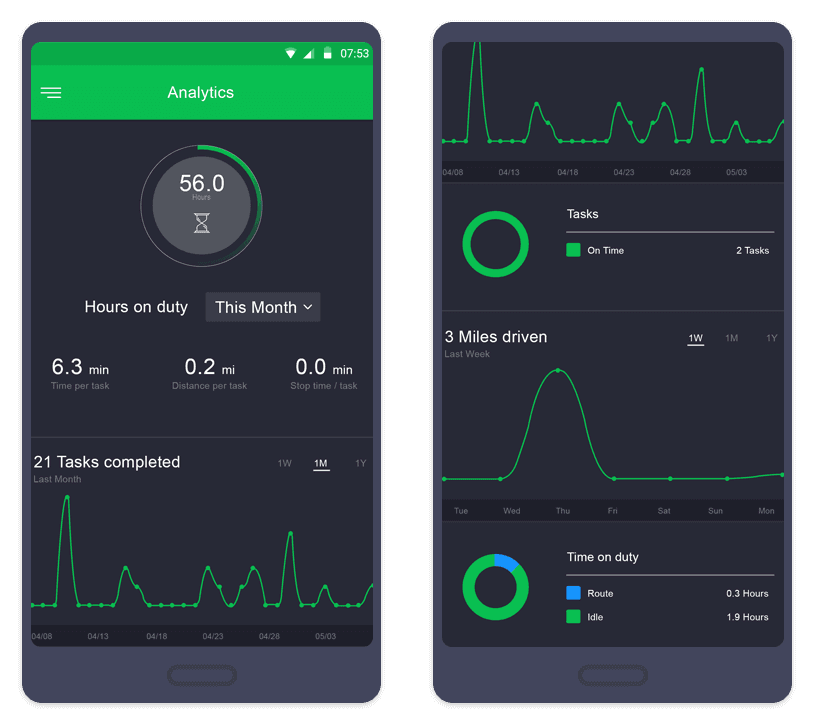
Take the best decisions with analytics
Get a bird’s eye view of the daily or monthly statistics of all your tasks and its status in a graphical form, with the analytics.
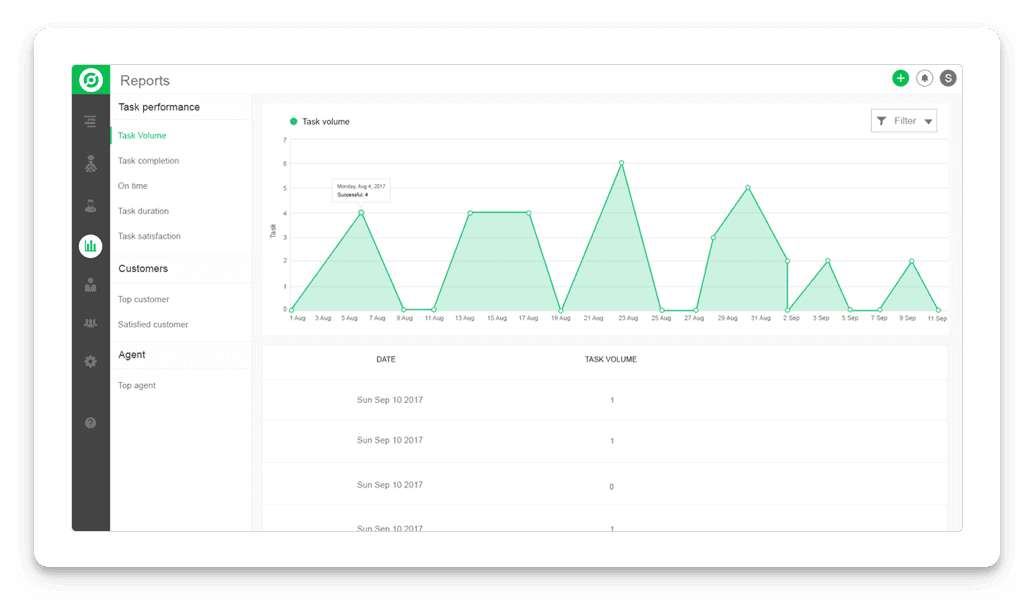
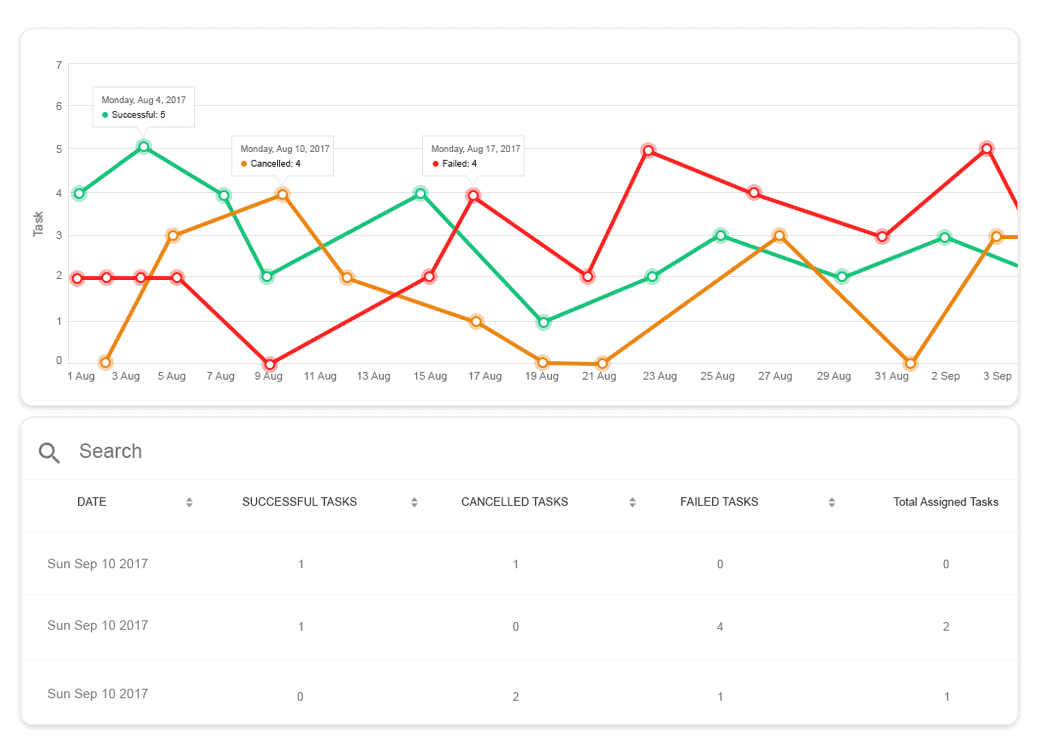
Graphical view of your business
View the statistics of your business graphically, representing the rise and fall of business, along with view of completed tasks, delayed tasks and on going ones.
Track your miles
Track the distance travelled by your agents along with the type of task, delivery or pickup and the total distance that the agents travelled throughout the day.
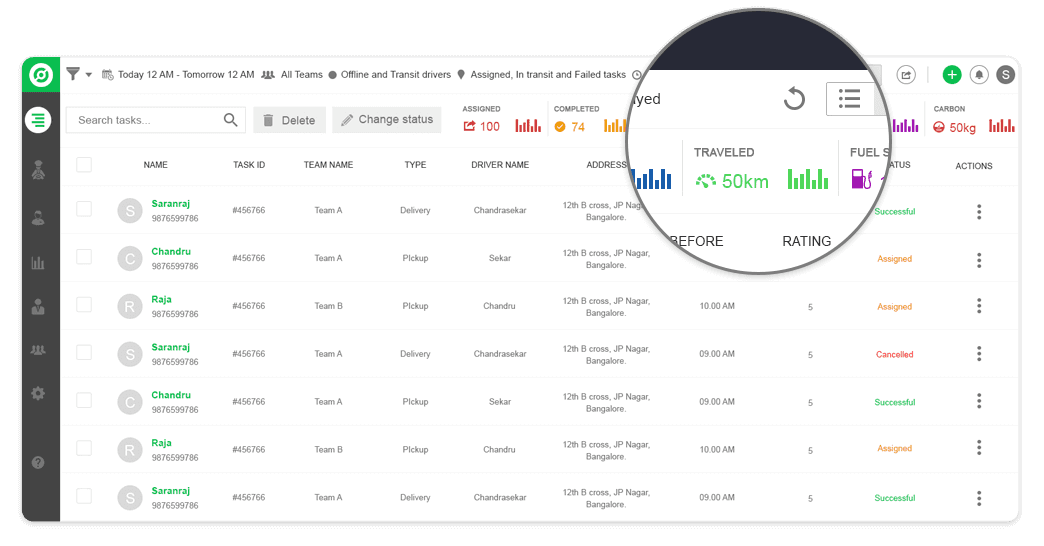
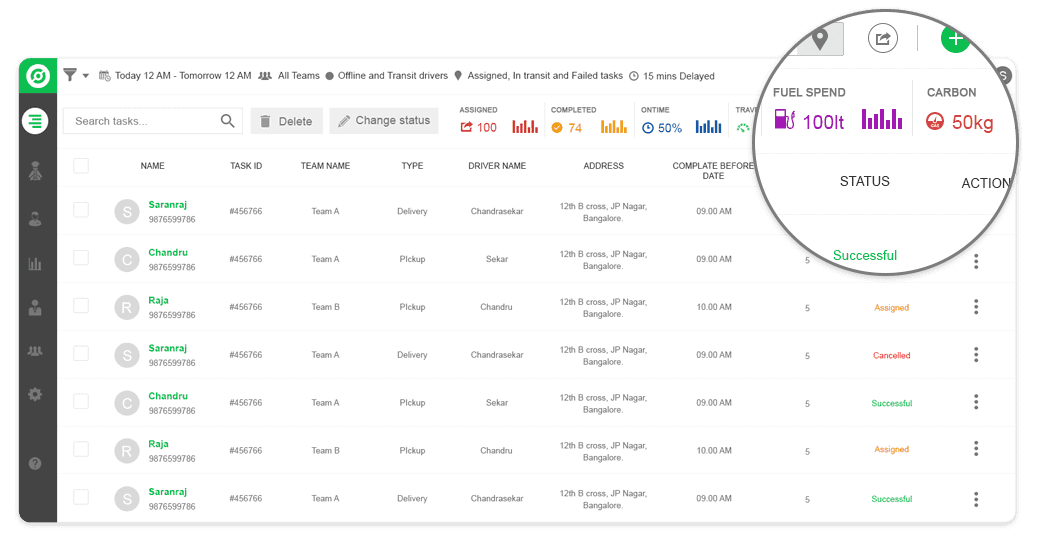
Fuel and carbon check
Be alert about how much fuel you consume and carbon you emit. This dashboard helps you with these reports and allows to get an estimation of the money spend on fuel by your delivery or pickup agents.
Agents reports
The agents also have a tracker for themselves to get a summary of his daily working hours, along with the number to tasks completed and type of tasks. This assists the agents to maintain a record of all their tasks and duty hours.
